Demonstrating impact
InCites Reports
Combining an up to date ORCID with InCites, can produce a comprehensive citation report for yourself very quickly. If you do not have an ORCID that connects all of your publications, you can import search results from Web of Science into InCites for analyses. View the details and guides for each option below.
Option 1 - InCites Researcher Report
You have an ORCID or Researcher ID that is up-to-date.
Option 2 - Analyse publications dataset from Web of Science
You do not have an ORCID or Researcher ID, or they are not up-to-date.
Option 1 - InCites Researcher Report
Requires:
An up to date ORCID or Researcher ID associated with all of your publications in Web of Science.
Use if:
You want a quick overview of your work and metrics.
Provides:
- an overview of output and citations,
- Catergorised Normalised Citation Impact (CNCI) aggregated or breakdown by subject areas,
- most cited documents, citations analysed by subject area and
- collaboration analysis.
-
Note your ORCID or Publons ResearcherID.
-
Log in to InCites (Uses the same log in as Web of Science, Publons and Endnote Online).
-
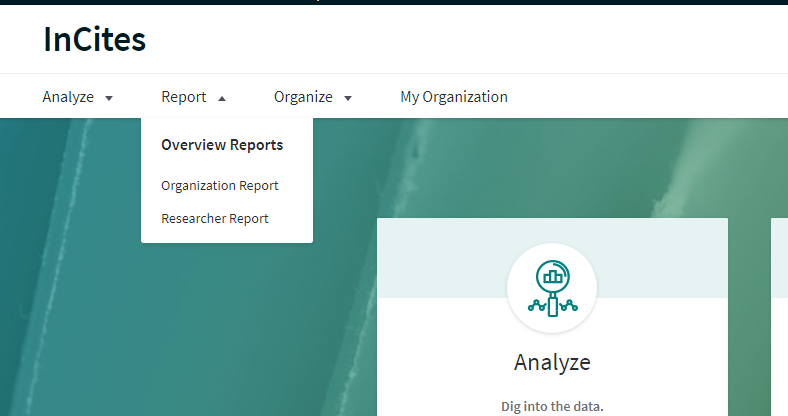
Go to Report and then Researcher Report.
-
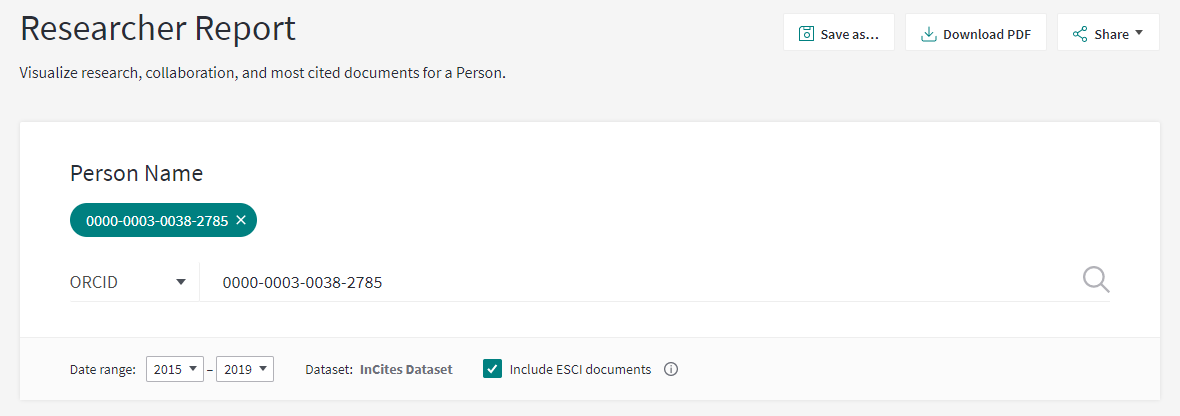
Under Person Name enter your ORCID or Researcher ID.
-
This will generate a researcher report ready to analyse.
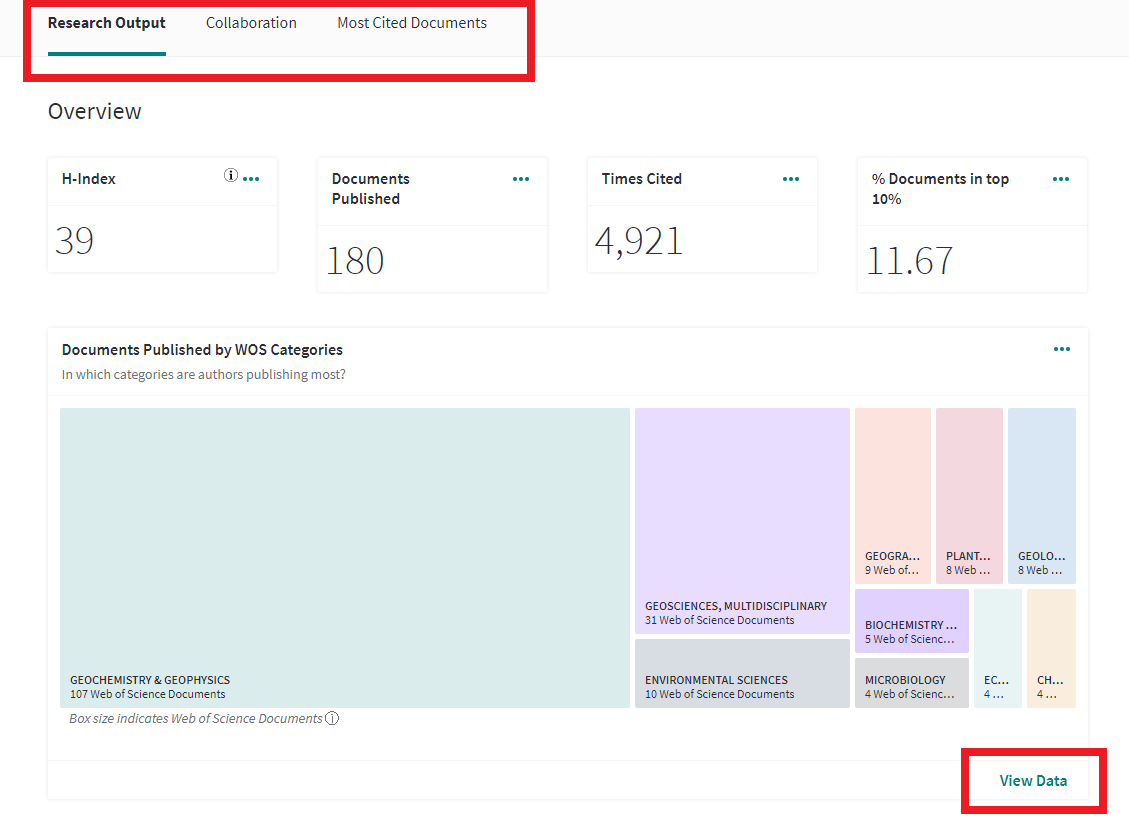
A Researcher Report, based on publication and citation data in Web of Science, has three parts:
Research Output
- Overview of your research output (H-Index, Documents published, Times Cited, % Documents in Top 10%)
- Research areas most published in
- Documents published and citations per year
- Impact of journals published in
- Citation impact by Research area
Collaboration
- Overview of international collaboration and collaboration by industry
- Overview of collaborating institutions
Most Cited Documents
- Lists your output ranked by citation
-
Click on View Data to get a more more detailed breakdown of each section.
-
For more information on how to analyse by research area, all of your publications or by individual publications see the below guides.
Option 2 - Analyse publications dataset from Web of Science
Use if:
If you do not have an ORCID linked to Web of Science or Researcher ID, or if you are not confident that they are to date.
Provides:
- an overview of citations across career or by subject area,
- Catergorised Normalised Citation Impact (CNCI) aggregated or breakdown by subject areas,
- most cited publications,
- international and industry collaboration.
If you do not have an identifier capturing all of your work in Web of Science it is still possible to create a report in InCites as long as you have work in Web of Science.
-
Go to Web of Science and search for your publications. See the Search for an authors publications on the Web of Science page for more information.
-
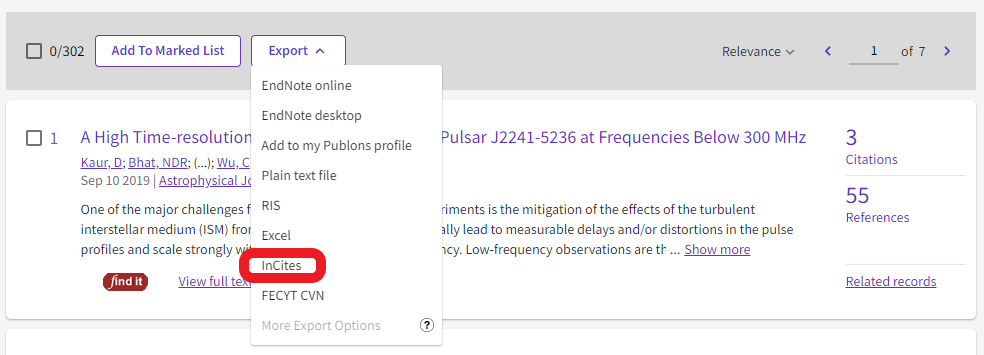
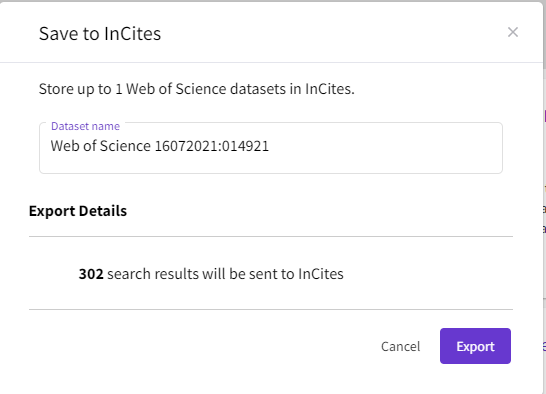
Once you have all of your publications, either as a single search results list or as a marked list from the top of the results list, go to the Export dropdown menu and select InCites.
-
You will need to sign in using your InCites credentials (these are the same as those for Web of Science, Publons or EndNote Online).
-
You can then name the file and it will be exported as a dataset to InCites.
-
You can now open the dataset in InCites and analyse the publications you have selected using InCites. See the Guide to analysing by research area section below for an example.
-
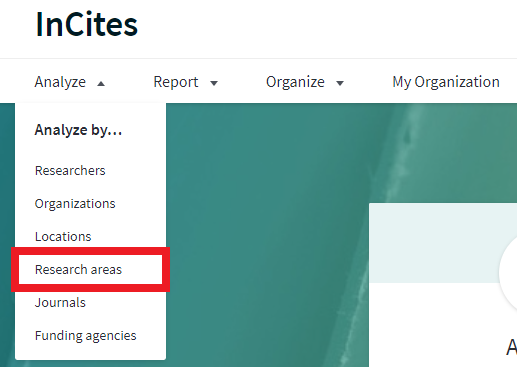
Research Area reports can be reached from the Analyze menu.
-
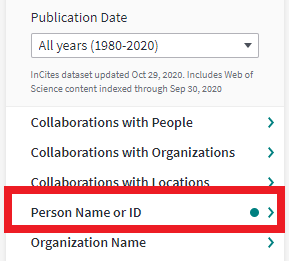
If you have exported your publications from Web of Science you can select your dataset from the Dataset dropdown menu in the Filters menu.

-
If it is not already selected it is recommended that you select Include ESI documents.
-
By default, a publication date of the previous five years will be selected e.g. 2015-2019 so you may want to change to a broader timeframe.
-
Alternatively, to view your publications using a researcher identifier go to Person Name or ID, select your ID Type and enter your identifier.

Research Areas will list all of the research areas (using the Web of Science categories) that your output is in listing:
- the number of your documents from Web of Science in each category,
- the number of citations for your publications in each area,
- the percentage of your publications in the research area that have been cited
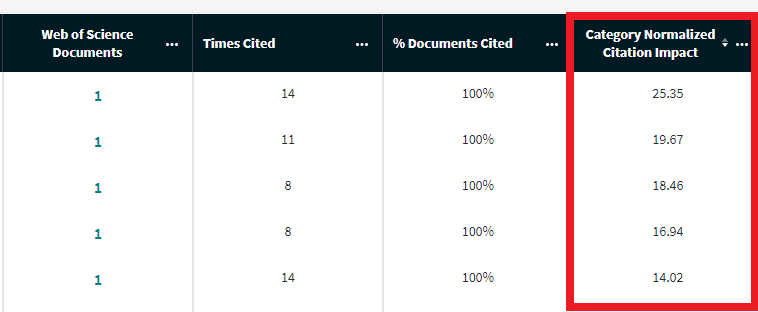
- Category Normalised Citation Impact
- a number of other metrics (indicators) you can add
If you want to benchmark your work against other publications in the same research areas use Category Normalised Citation Impact (CNCI). This is a measure that compares the number of citations a publication or group of publication have got in comparison to others of the same type, in the same research area, that have been published in the same year.
There are are number of different indicator metrics that can be used to measure the impact of your output in the academic sphere
-
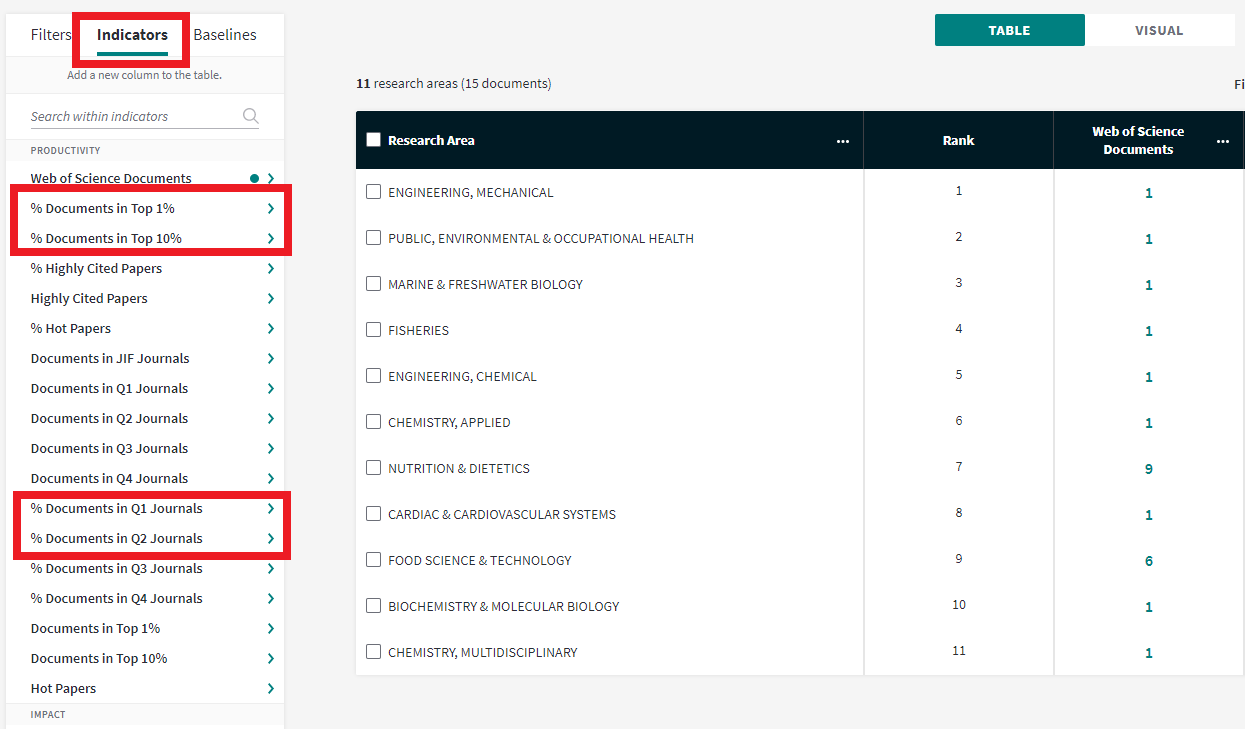
Go to the Indicators menu on the left side of the page and add columns to the table that you think will best demonstrate the strengths of your e.g. % of your documents in the top 10% or top 1% for research area and year or % of your documents in Q1 journals.
-
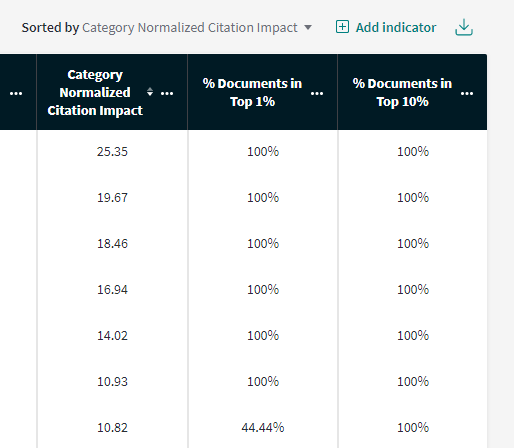
Click on any column to sort by that metric highest to lowest or vice versa.
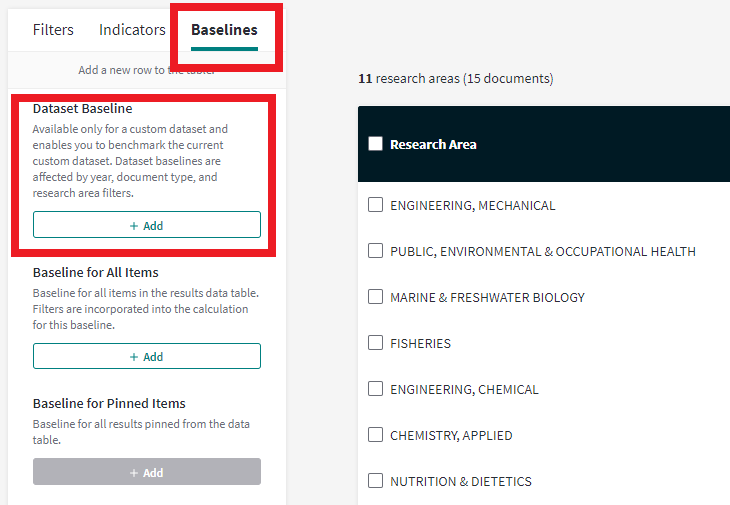
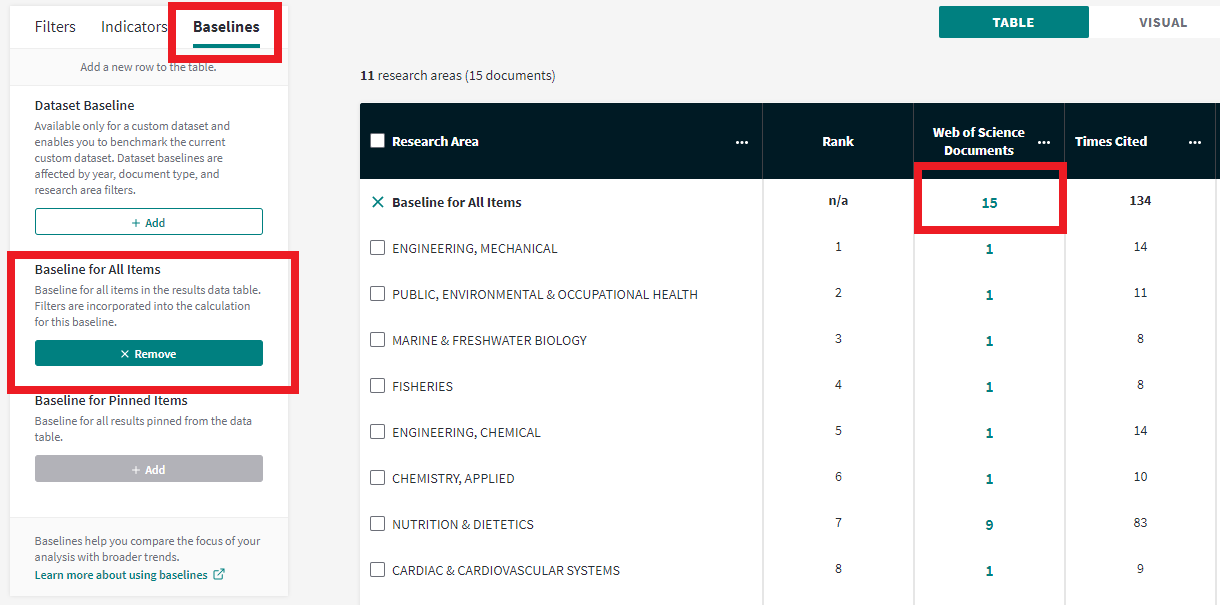
In order to see metrics such as CNCI across all of your works you will need to add a baseline.
-
Go to the Baselines menu on the left and select Global Baseline or Dataset Baseline (depending if you are creating a report using filters such as Author Identifiers or an imported Dataset from Web of Science).
-
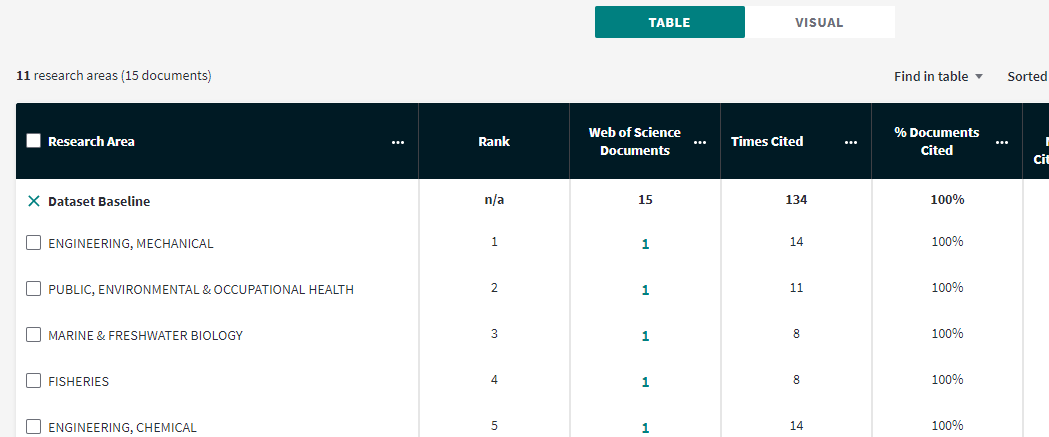
This will show the metrics/indicators for all of your works e.g. instead of just the performance of your work in different subject areas across all subject areas e.g. the CNCI or number of citations for all of your publications rather than just those that fall into a particular research area.
-
There is also the option to select a baseline for All Items which incorporates all filters applied.
-
To see the metrics, such as CNCI, for each individual publication simply click on the number in the Web of Science Documents column.
-
If you want to see all of your documents go to Baselines and add a Baseline for All Items.
-
You will be able to see the Category Normalised Citation Impact (CNCI) for each individual article along with the number of citations each has received and the percentile in the subject area (a good benchmark as to how well it is doing to other comparable articles). You can Download the table as a csv.
