Demonstrating impact
Category Normalised Citation Impact (InCites)
What is Category Normalised Citation Impact (CNCI)?
Citation rates vary across disciplines, change over time and different publication types have different citation behaviours. For accuracy and fairness, citation data should be normalised ** by discipline, year and publication type, making it an unbiased indicator of impact.
The Category Normalised Citation Impact (CNCI) used by InCites benchmarks the impact of an article or the impact of a researcher in a particular subject area. The CNCI of a document is calculated by dividing the number of citations by the expected citation rate for documents of the same type, year of publication and subject area. The CNCI for a set of documents, such as the work of an author or a group of authors, uses the average of all the CNCI values for documents in the set.
CNCI can also apply across several subject areas although it is a more meaningful metric if it is only for a single subject area.
A CNCI of 1 would be on par with the average citations for the subject area; more than 1 would be above average; and anything below 1 would be less than average.
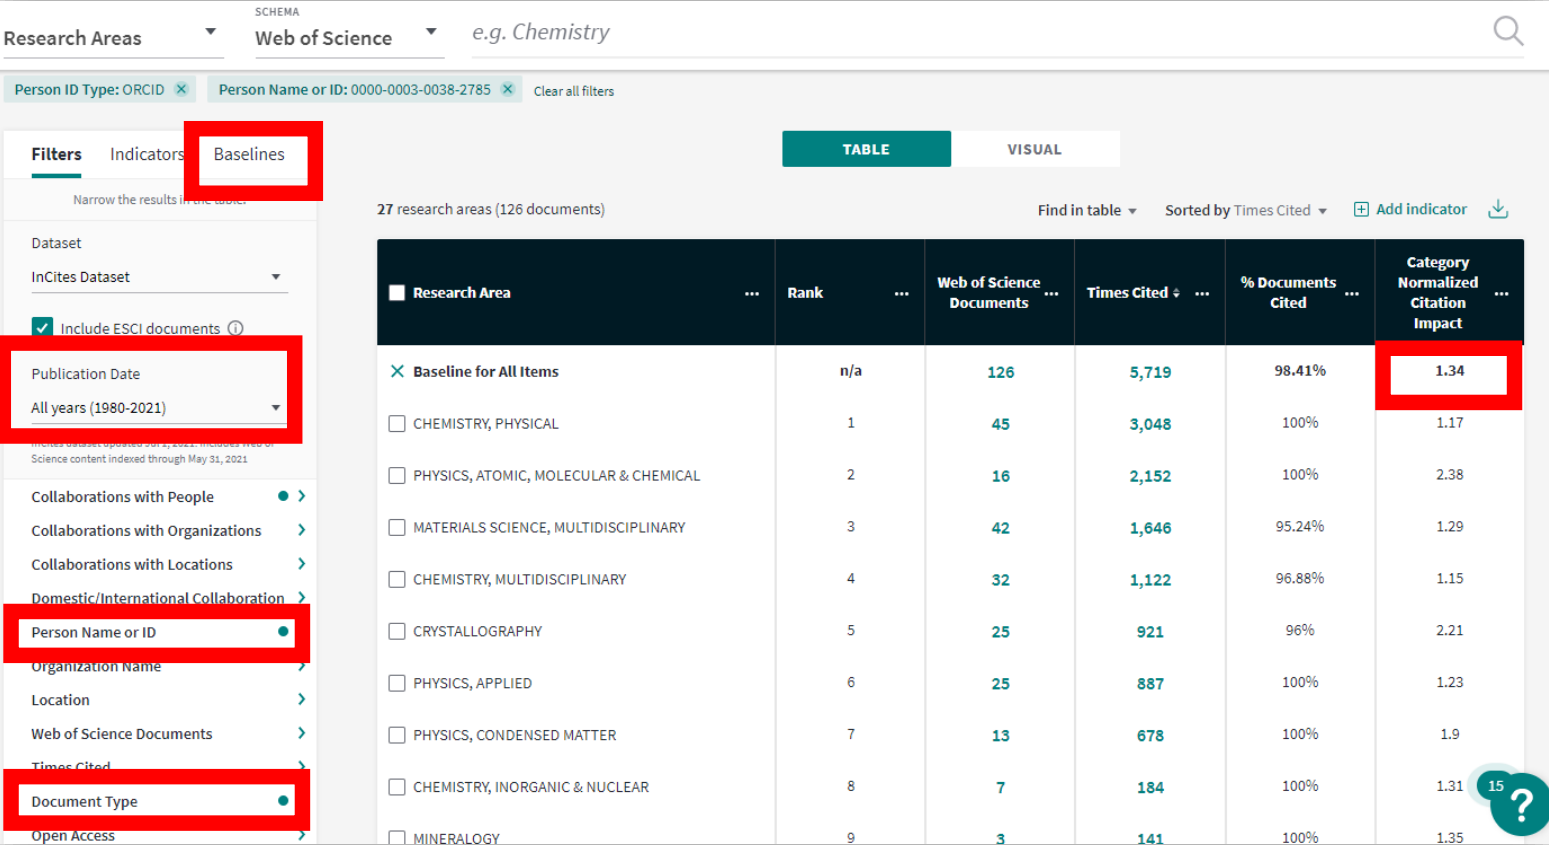
- In InCites go to Analyse » Analyse by research areas.
- In the Filters column go to Person Name or ID, select Unique ID, then select ORCID and enter your ORCID in the text box.
- By default, your results will be filtered to Publication Date of the last 5 complete years. Change this to All years.
- It is recommended that you filter by just Articles and Reviews as researchers sometimes have proceedings and abstracts that rarely get cited and bring their CNCI down. Under Filters go to Document Type, select the document types that you want to include and click Update Results.
- Select Benchmarks (from the left-hand tab menu) and add Baseline for all items.
- This will give the metrics for your career (in the top line) and broken down by research area underneath it.
Example:
In this example below the researcher has a career CNCI of 1.34.

Note:
- CNCI in InCites is the equivalent of the Field Weighted Citation Impact (FWCI) used by SciVal but using data from Web of Science.
- If you want to use FoR codes instead of Web of Science categories:
- From Filters go to Research Area » Schema and select Australia FOR Level 1 or Level 2.
- If you want to add other indicators to measure your impact:
- Go to the Indicators tab on the left-hand side to see the options such as percentage of documents in top 10%, percentage of documents in Q1 journals and so on.
- For researchers who do not have an ORCID or Researcher ID, or they are not up-to-date view the InCites reports - Analyse publications dataset from Web of Science guidance.
Field Weighted Citation Impact (Scopus)
Field Weighed Citation Impact (FWCI) takes into account the differences in research behaviour by comparing the number of citations an article has received to the average number of citations for similar articles. It compares articles with the same publication year, type and from the same discipline drawing on citation data from the Scopus database.
A FWCI of 1 would indicate an article is on par with the average for the articles it is being compared with.
A FWCI below 1 would indicate an article that is below average for the articles it is being compared with.
A FWCI above 1 would indicate an article that is above average for the articles it is being compared with.
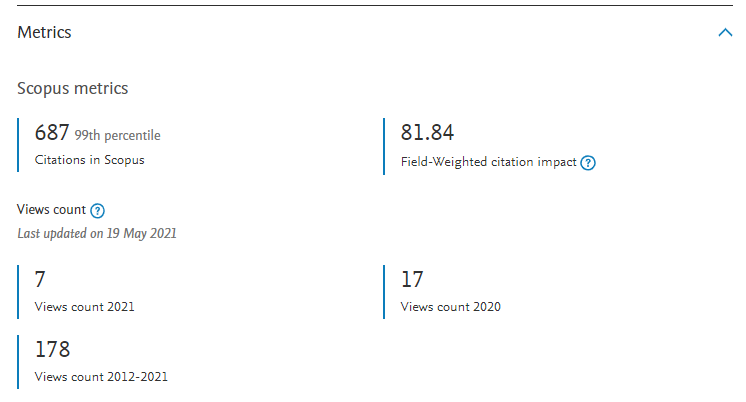
Scopus provides the FWCI for each article with the document details. To view the FWCI, along with some other useful metrics go to the Metrics tab in the Document Record.

The percentile metric is similar showing how many citations a publication has received compared with other publications from the same publication year, of the same type and from the same discipline. e.g. if it is in the 99th percentile it has received more citations that 99% of the other publications of the same type, with the same research area from the same year.
It is possible to manually calculate the FWCI for a researchers output using this by determining the average of the FWCIs for all of a researchers output i.e. the sum of the FCWIs of a researcher’s articles divided by the number of articles.
Scopus: Access and use Support Center - What is Field-weighted Citation Impact (FWCI)?.
Measures of esteem
In addition to citations, you can include esteem measures into any grant or promotion application.
- Recipient of a nationally competitive research fellowship
- Membership of a statutory committee
- Recipient of an Australian Council grant or Australian Council fellowship
- Invitations to speak, particularly as the keynote speaker
- Involvement in committees, organisations or societies
- Editor or reviewer on a major journal or of a of a prestigious work or reference
- Awards or rankings in prestigious lists
- Fellowship of a learned academy
Calculate your H-index
The H-Index, proposed by Jorge Hirsch in 2005, looks at the number of articles by an author (or group) and the number of times those articles have been cited. It combines this data to produce a single number - the h-index.
The h-index is calculated where h number of articles have been cited h or more times.
Example: An h-index of 10 means an author has ten articles that have each received ten or more citations.
An h-index can be generated for an author in both the Web of Science and Scopus databases based on the citations data for indexed articles in each of them.
The following presentation explains how to calculate the h-index, along with some of the limitations with it as a measure of research impact.
Career Conversations Instructions
Metrics and Altmetrics Calculations
Researchers completing Career Conversation documentation may find these instructions helpful for locating some of the metrics and altmetrics specified in the research metrics table in the Academic Performance and Career Plan Template.
Academic Performance and Career Plan: Instructions for completing the Research Metrics Table [PDF, 1.28MB] [Curtin Staff login required]