Demonstrating impact
Number of citations
Citation counts show how many times an individual publication has been cited by other scholarly works. As each citation database indexes different journals, conference papers, books, and other publication types, citation counts will vary between platforms. When reporting citation counts, it is good practice to specify the source of the data.
Where to find it:
- Google Scholar: Search for your publication to view the Cited by count. Google Scholar generally reports higher citation counts because it indexes a broader range of scholarly content, including theses, books, preprints, conference papers, and institutional repositories.
- copus: Search for your publication and open the document record to view the Citation Count and the publications that have cited your work.
- Web of Science: Search for your publication to view the Times Cited count and access the publications that have cited your work.
Field Weighted Citation Impact
Field Weighed Citation Impact (FWCI) takes into account the differences in research behaviour by comparing the number of citations an article has received to the average number of citations for similar articles. It compares articles with the same publication year, type and from the same discipline drawing on citation data from the Scopus database.
A FWCI of 1 would indicate an article or researcher is on par with the average for the articles it is being compared with.
A FWCI below 1 would indicate an article or researcher that is cited below the global average
A FWCI above 1 would indicate an article or researcher that is cited above the global average
Scopus provides the FWCI for each article with the document details. To view the FWCI, along with some other useful metrics go to the Metrics tab in the Document Record.
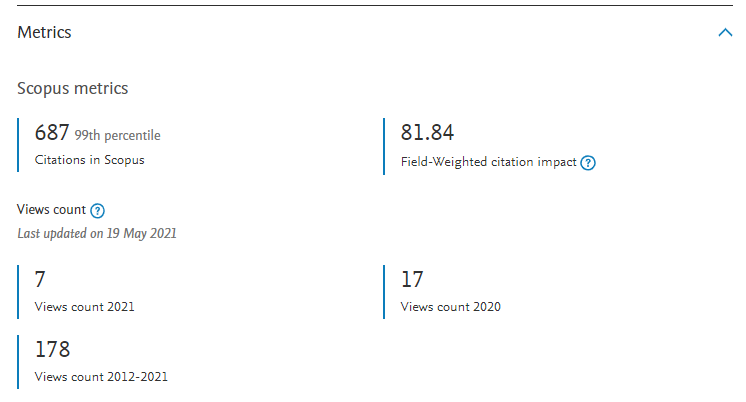
The percentile metric is similar showing how many citations a publication has received compared with other publications from the same publication year, of the same type and from the same discipline. e.g. if it is in the 99th percentile it has received more citations that 99% of the other publications of the same type, with the same research area from the same year.
It is possible to manually calculate the FWCI for a researchers output using this by determining the average of the FWCIs for all of a researchers output i.e. the sum of the FCWIs of a researcher’s articles divided by the number of articles.
Publications in the Top 1% and 10%
These metrics identify publications that are among the top 1% or top 10% most cited globally for their field, publication year, and document type.
Where to find it: Available in SciVal. Define an entity, and then navigate to the Compare tab. Under the Publication metrics section, you will find articles in the top 1% and 10%.
Article views and downloads
Article views and downloads measure how often a publication has been accessed or downloaded. While they do not indicate scholarly impact, they can provide evidence of readership and interest.
Where to find it:
- Publisher website: Many publishers display article views and/or download counts on the article page.
- Institutional repository: Repository records include views and downloads for deposited publications. (These were not migrated from eSpace to CURATE)
- SciVal: View usage metrics for publications where available. SciVal sources these metrics from participating publishers via Elsevier’s PlumX Metrics, so coverage varies by publisher and publication.